| Size: |
270x325x86 mm |
| Weight: |
3.8 Kg |
| Clock: |
<1 min. accuracy, months and leap years adjust automatically.
Has day light savings feature. |
| Battery: |
Re-chargeable, operates for over 12 hours from full charge.
Display shows battery voltage and warns when re-charge is required. |
| LCD: |
Alphanumeric backlight, 1 line 16 characters. |
| Keyboard: |
Fully alphanumeric. Functions are clearly displayed for
easy access. |
| Printer: |
Built in 40 column Dot matrix with graphics. |
| Range: |
0 to 150% G. |
| Accuracy: |
Plus/minus 2%. |
|
| |
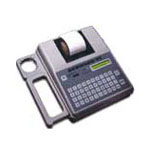
| Electronic |
| Portable |
| Easy to use |
| Minimal training required |
| Requires one person to operate |
| Suitable for testing all types of vehicles |
| No connections to vehicles required |
| Has own power source |
| Tests both service and hand brakes |
| LCD display |
| Fully alpha numeric keyboard |
| Gives print out evidence of test results |
| Graphic print out of results |
| Self contained with rugged exterior |
| Full 12 month warranty |
|
|
| Feature : It will not only show what speed the vehicle was travelling at but also will convert the figures as if the vehicle is travelling at 20mph or 32km/h. |
Interpreting Results

The Bowmonk VI print out shows the following information:
Date and Time This is the data and time of the Brake-Test.
Next Cal Date Date when Bowmonk VI is due for recalibration.
ExaminerIs the person who conducts the test.
Registration This is the registration or VN number of the vehicle.
Newton’s The amount of pedal pressure required to stop the vehicle.
Graph Shows the performance of the vehicle during braking.
Decel Max Maximum g force during test.
Average Decel Refers to accumulative g force over duration of test.
Test Duration Time taken to conduct test.
Speed of the Test The speed at the start of the Test
Stopping Distance The distance traveled after applying brakes until vehicle stops.
Stopping Dist (NA) Maximum Deceleration and extrapolated as if the vehicle were going 20 MPH regardless of the actual Speed of Test.
Performance Shows brake effort expressed as a percentage
Brake delay The time lag between the brake control being operated and the instantaneous brake effort.
Slope Angle during test
Signature This is the examiners signature.
Company Name This is optional, see text.
Newton’s Newton's refers to foot pedal pressure. Approx. 10 Newton’s equals 1kg of force.
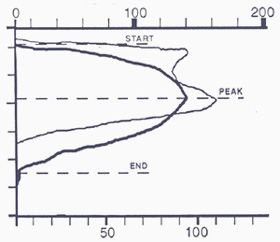
Newton ScaleThe top axis on the graph refers to Newton’s. The scale is adjusted based on the maximum Newton’s.
Newton Graphic The thin line on the graph refers to the Newton’s or pedal pressure during test.
Max Maximum Newton's during testing.
Pk At peak deceleration the Newton’s or pedal force is measured.
Deceleration Deceleration is measured by g force.
G Force Scale The bottom axis on the graph refers to g force. The scale is adjusted based on the maximum g force.
G Force Graphic The thick line on the graph refers to the g force or deceleration during testing.
Time Time is shown on the vertical axis and is measured in seconds.
Deceleration Scope
Refer to the Test printout for information. |